| It can be hard to focus on serious research and writing when the weather is so gorgeous, so the first BBA newsletter of spring 2016 provides lots of great information and data in a fun form—infographics. There are several that, like crocuses and daffodils (and cherry blossoms), are beautiful and aching to be shared, so we offer them up here in the hope that you’ll stop to enjoy them yourself and with friends.
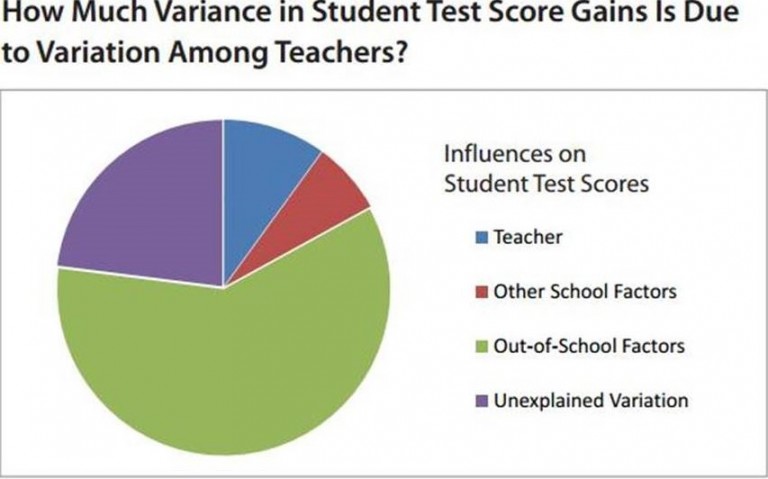 Some of these illustrate the need for a Broader, Bolder Approach to Education, and the many aspects of children’s lives and educational experiences, both in school and beyond, that policymakers should take into account. Perhaps the simplest is this pie chart by Stanford University professor Edward Haertel, which was presented as part of the William H. Angoff Memorial Lecture he gave for the Education Testing Service about concerns with the use of so-called Value-Added Measures to evaluate individual teachers’ effectiveness. The wedges represent approximate shares of each of four sets of factors driving student test scores—teachers, other in-school factors, out-of-school factors, and others/miscellaneous – and thus achievement gaps in them, based on decades of research, starting with findings from James Coleman’s seminal 1966 report to Congress. Some of these illustrate the need for a Broader, Bolder Approach to Education, and the many aspects of children’s lives and educational experiences, both in school and beyond, that policymakers should take into account. Perhaps the simplest is this pie chart by Stanford University professor Edward Haertel, which was presented as part of the William H. Angoff Memorial Lecture he gave for the Education Testing Service about concerns with the use of so-called Value-Added Measures to evaluate individual teachers’ effectiveness. The wedges represent approximate shares of each of four sets of factors driving student test scores—teachers, other in-school factors, out-of-school factors, and others/miscellaneous – and thus achievement gaps in them, based on decades of research, starting with findings from James Coleman’s seminal 1966 report to Congress.
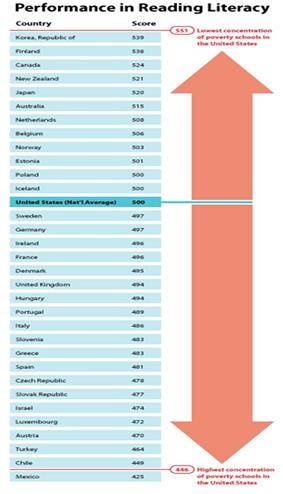
This chart illustrating where US students rank in reading literacy on the PISA, relative
to their peers in other wealthy nations, is noteworthy particularly for the stark contrast it paints between students in the highest-poverty versus the lowest-poverty schools. Articles that report only how average students perform have prompted policymakers to bemoan “mediocre” schools and a resulting lack of international competitiveness. As we see when we distinguish between US schools serving high-income students and the growing number in which most, or even all students live in poverty, that’s not the case. Rather, when rates of student poverty look like those in the most equitable countries, like Finland, our students outperform even Korea (and Finland). But in many schools dealing with a host of poverty-related stresses and trauma, scores are lower than those in Chile and just above those in Mexico.
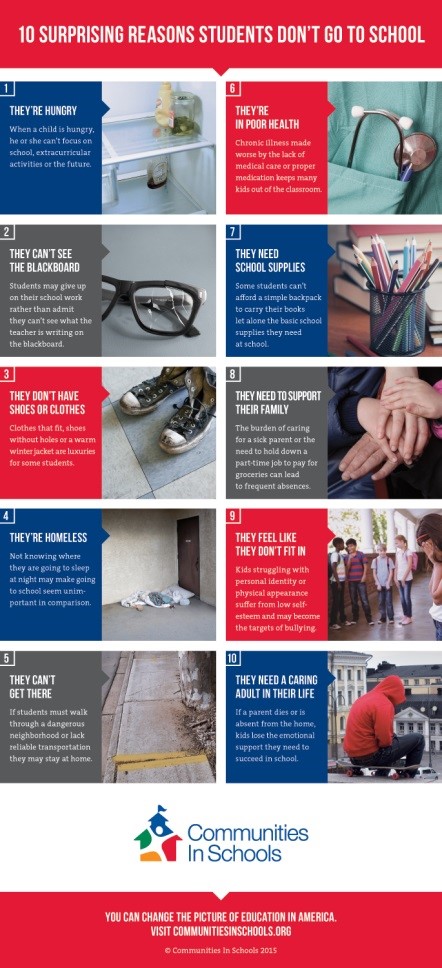 This terrific graphic by Communities in Schools helps explain how student poverty translates into concrete barriers to those students’ success in school. There are the basics that we hear a lot about – kids who live in poverty are more likely to be hungry, and thus not focused in class, or to have a chronic health problem or crisis that keeps them out of school altogether. Many parents earn so little money that they can’t afford the shoes, clothing, and school supplies that kids need (and without which they feel a sense of stigma that exacerbates social and emotional problems). But, as the title indicates, there are also barriers we hear less about. Like how many students are homeless, which is a substantial and growing problem in many schools. Or how many don’t have the glasses that would let them see the blackboard, and so get labeled as failing students or learning disabled. Or don’t have the support of a caring adult that carried so many of us through rough patches at school – patches that are a lot more common among kids living in poverty. Or, speaking of support, are themselves important breadwinners (and/or caretakers) for their family, and need to work taking care of siblings in the home or work for pay outside the home or both, which makes it that much harder to get homework done and get a decent night’s sleep, and thus a good test score. In other words, without a Broader, Bolder Approach to Education, a large and growing share of US students face multiple barriers to thriving in school. This terrific graphic by Communities in Schools helps explain how student poverty translates into concrete barriers to those students’ success in school. There are the basics that we hear a lot about – kids who live in poverty are more likely to be hungry, and thus not focused in class, or to have a chronic health problem or crisis that keeps them out of school altogether. Many parents earn so little money that they can’t afford the shoes, clothing, and school supplies that kids need (and without which they feel a sense of stigma that exacerbates social and emotional problems). But, as the title indicates, there are also barriers we hear less about. Like how many students are homeless, which is a substantial and growing problem in many schools. Or how many don’t have the glasses that would let them see the blackboard, and so get labeled as failing students or learning disabled. Or don’t have the support of a caring adult that carried so many of us through rough patches at school – patches that are a lot more common among kids living in poverty. Or, speaking of support, are themselves important breadwinners (and/or caretakers) for their family, and need to work taking care of siblings in the home or work for pay outside the home or both, which makes it that much harder to get homework done and get a decent night’s sleep, and thus a good test score. In other words, without a Broader, Bolder Approach to Education, a large and growing share of US students face multiple barriers to thriving in school.
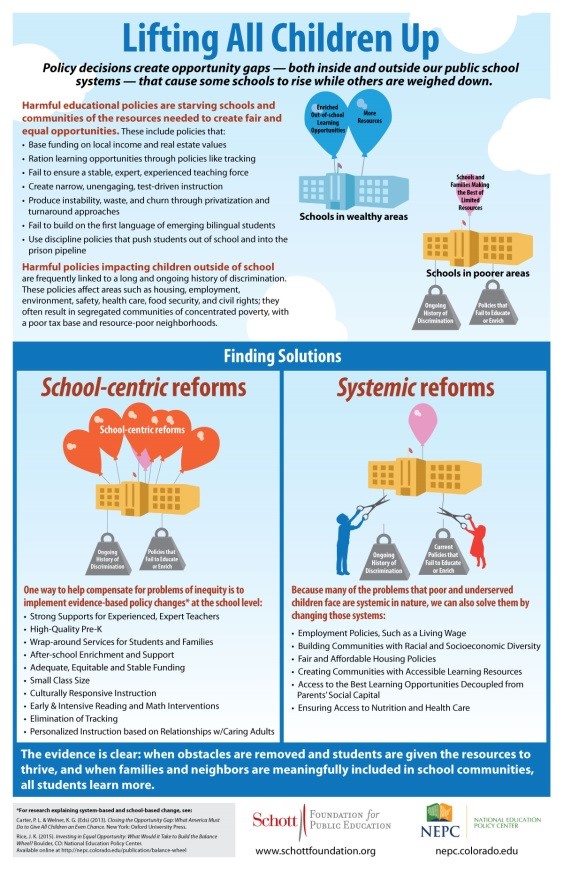
Indeed, this new graphic from the Schott Foundation and the National Education Policy Center could not be more relevant to the #BBAreboot. With this year’s primary campaigns highlighting vast societal inequalities driving rage and despair, but also renewed momentum for major change, this graphic illustrates how heavily those inequities weigh down schools serving low-income and minority students and the systems needed to address them. The first system, on the left, reads like the new BBA playbook—a series of birth-to-five poverty-mitigation supports that can counter the effects of inequities. The right-hand side illustrates strategies for poverty reduction, rather than mitigation. I.e., instead of working to counter the weight of inequities, we could substantially reduce them, which would relieve much of the pressure on schools and make other reforms much more effective. Both versions speak to the Broader, Bolder goal of improving the odds for all children—lifting them up—rather than helping some of them beat the (bad) odds.
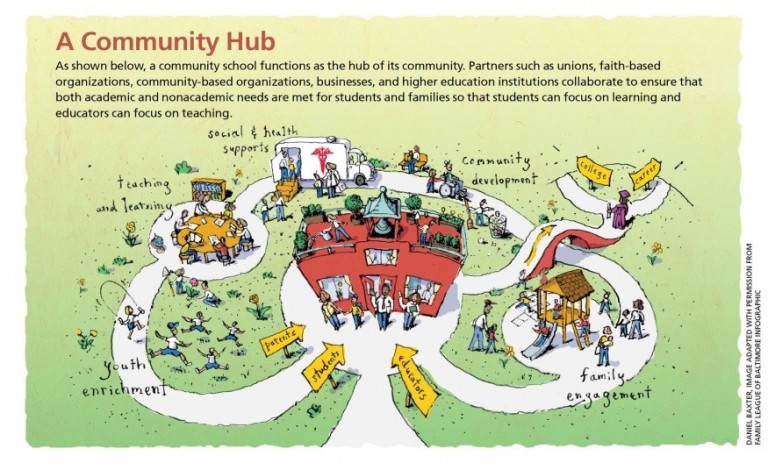 And this graph from the Coalition for Community Schools illustrates the logic, and the power, of having the entire community come together around a school-as-community-hub to support children and grow the community. In any given district, supporting entities could involve faith leaders and congregations who help organize weekend backpacks of food and provide mentors , social services and health agencies that ensure immunizations and mental health support are in place, teachers unions—who often take a leading role in such reform efforts—and local businesses, whose support ranges from energy bars to eyeglasses and even apprenticeships. As research has shown, this helps “ensure that both academic and nonacademic needs are met for students and families so that students can focus on learning and educators can focus on teaching.” And this graph from the Coalition for Community Schools illustrates the logic, and the power, of having the entire community come together around a school-as-community-hub to support children and grow the community. In any given district, supporting entities could involve faith leaders and congregations who help organize weekend backpacks of food and provide mentors , social services and health agencies that ensure immunizations and mental health support are in place, teachers unions—who often take a leading role in such reform efforts—and local businesses, whose support ranges from energy bars to eyeglasses and even apprenticeships. As research has shown, this helps “ensure that both academic and nonacademic needs are met for students and families so that students can focus on learning and educators can focus on teaching.”
We hope you found these illuminations as illuminating as we did! Thanks to the great graphic artists out there for helping us make sense of complex data and render it more accessible. And thanks to all of you BBA supporters for getting the word out both on the urgent need to mitigate the impacts of poverty on teaching and learning, and effective strategies to do so!
Thank you, as always, for your dedication to ensuring that all children receive a rich, comprehensive education and have the support they need to fulfill their potential. We look forward to continuing to work with you in 2015 and beyond, and to keep you informed of activities and policies that support a Broader, Bolder Approach to Education. Don’t forget to share our Facebook posts and follow us on Twitter! |